

It has now been just over a year since the first Low Traffic Neighbourhoods were introduced in London in response to the first lockdown and initial monitoring results are in from 4 of the London boroughs that introduced them at that time – Islington, Hackney, Lambeth and Southwark.
We thought that it might be helpful to summarise what the results have been so far. If we have missed anything (highly likely!) then please do get in touch and we will amend and add to these findings.
There are a couple of things to note before we get to the results. Firstly, with the exception of Hackney, all of the final results have been adjusted (normalised) to take into account the changes that were occurring in traffic volumes (owing to the pandemic) across the borough/London at the time that the post-implementation monitoring took place. So hopefully like is being compared with like. In Hackney, the council has given other data to allow comparison but has not adjusted the figures.
Secondly, cycling numbers do appear to increase dramatically when LTNs are introduced. The exception seems to be in Islington but that appears to be because the pre-implementation research was done during summer 2020 and the post-implementation work was done in November 2020 and February 2021 when overall cycling numbers are likely to be far lower.
Thirdly, we have always thought from previous research in the Mini-Holland boroughs (Waltham Forest, Enfield and Kingston) that the big winners when LTNs are introduced are people on foot[1] [2] but unfortunately none of the data released so far captures the impact on walking. The available data to date therefore probably understates the active travel benefits of the new cohort of LTNs in London.
All of the raw data from the monitoring reports can be downloaded here. This spreadsheet has links to all of the Council monitoring reports.
So what have the results shown so far?
1. Motor traffic volumes.
- All Roads. While there are exceptions, the trend is one of a reduction in overall traffic volumes (across the roads that are both internal and external/peripheral to the LTN) with an average decline of 8.6% in total traffic volumes across the 7 studies (5 Lambeth and 2 Southwark) where estimates are given of this measure.
- Roads INSIDE the LTNs. There are 15 studies where we can assess the impact of the LTN on the volumes of traffic inside the LTN. There is an average decline of 45% in motor traffic volumes across the 15 studies with a maximum decline of 79% and a minimum fall of 17%.
- Roads OUTSIDE the LTN. On average, across 15 studies[1] traffic volumes on external/peripheral roads have increased by 4.5% with a maximum decline of 17% and a maximum increase of 44%. Across the 15 studies, there was a decline in traffic volumes on these roads in 7 studies and an increase in 8 studies.
2. Cycling.
- All roads. Total cycling volumes were measured in 7 studies (Lambeth and Southwark). All studies saw an increase in cycling volumes with the average across the studies being a 63% increase in cycling (the range was maximum +135% and the minimum was +33%).
- As noted earlier, the data for the internal and external roads is thrown by the dates of the Islington research but in Lambeth cycling on roads inside the LTNs averaged a 68% increase and on the periphery roads an increase of 62%.
Summary. So although these studies were often the first in a series of monitoring, is it reasonable to suggest the following?
- There is solid evidence to suggest that on the roads inside an LTN motor traffic volumes are likely to fall by up to a half.
- There is evidence to indicate that traffic evaporation is likely to occur when an LTN is introduced and that depending on the design and location of the scheme overall traffic volumes (inside and outside the LTN) will decline by more than 5%.
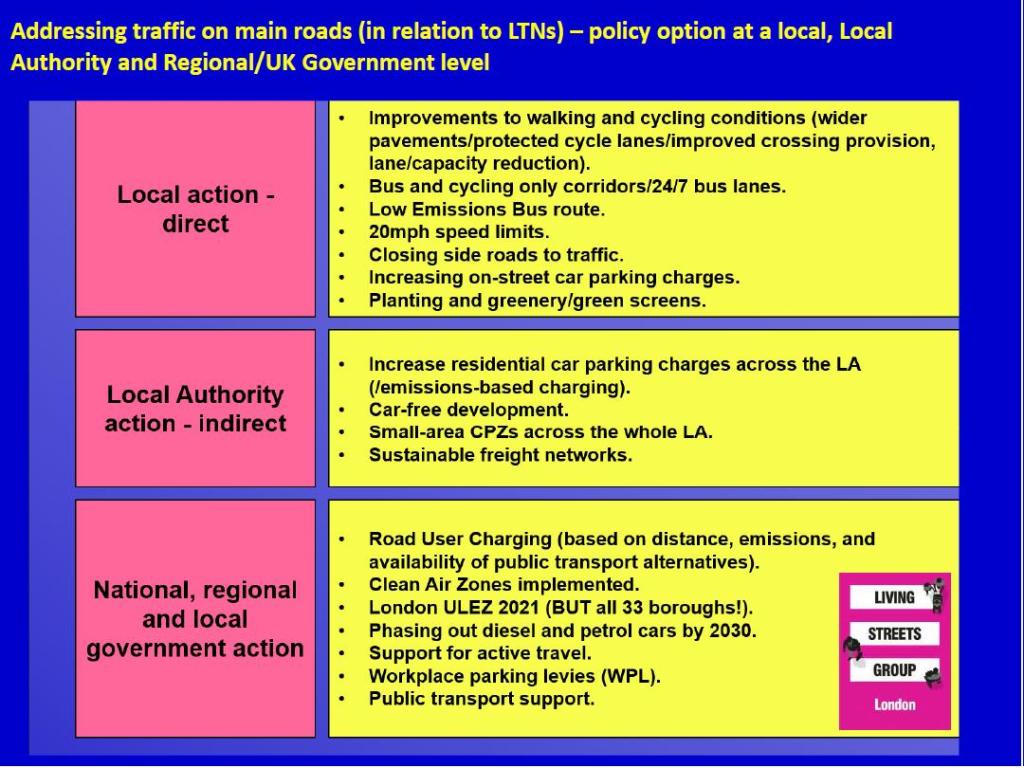
- Again, depending on the design and location of the LTN, traffic on external/periphery roads may rise by up to 5% and that when LTNs are developed, complementary measures should also be delivered that work to reduce traffic on nearby main/boundary roads. London Living Streets has developed a checklist for what should be considered and this is summarised in the chart below.
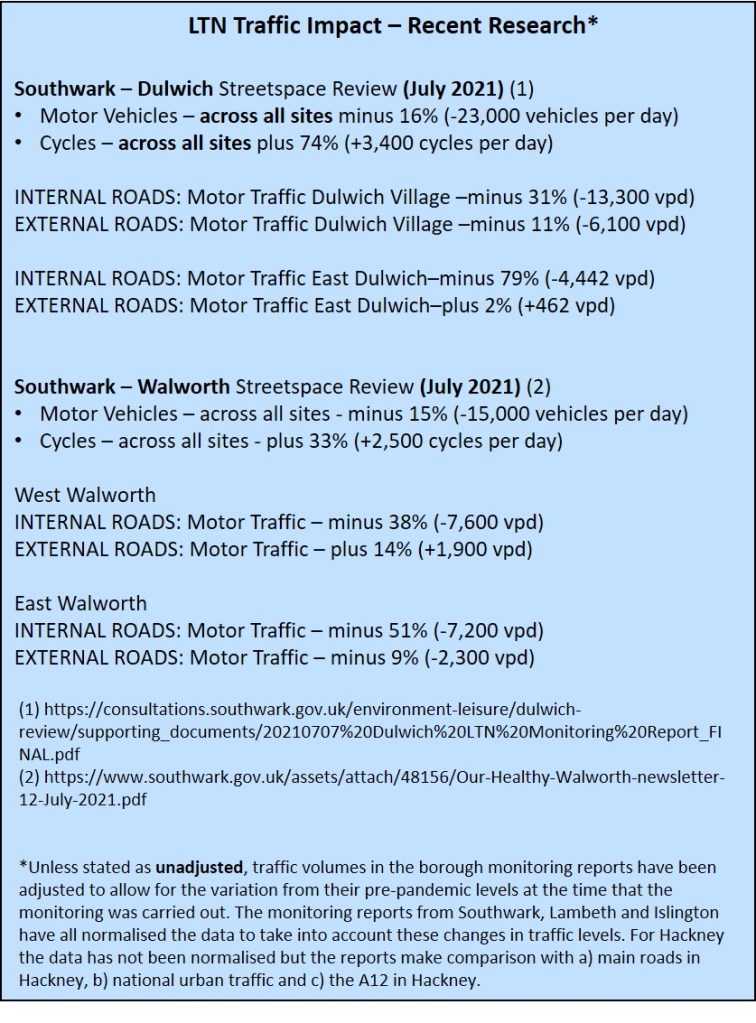
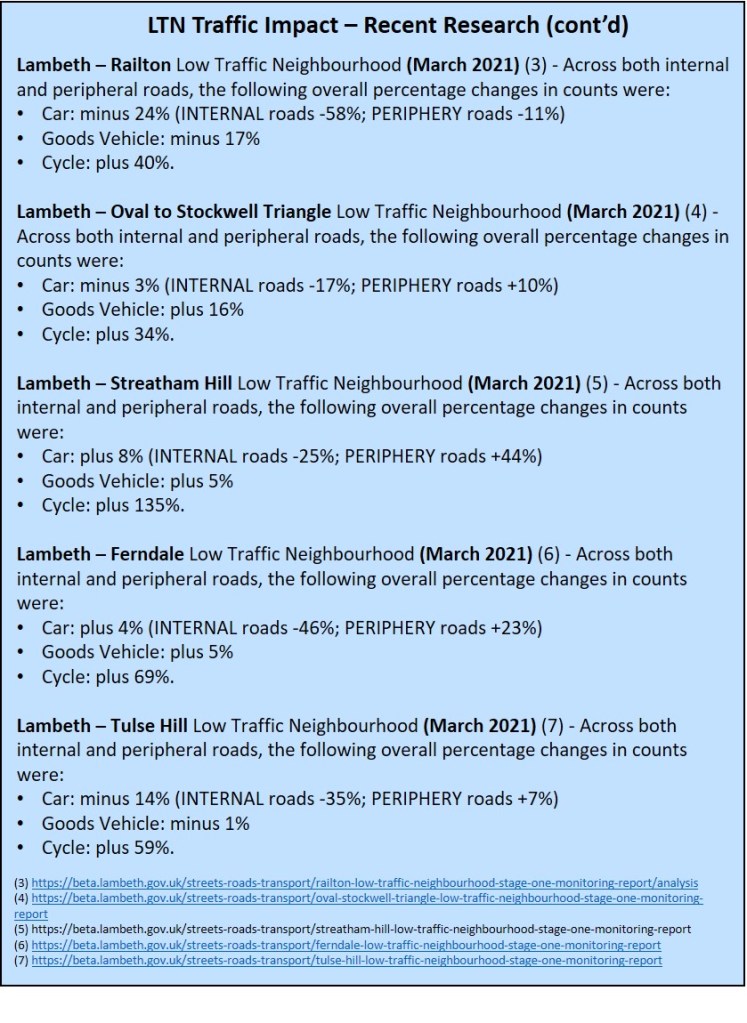
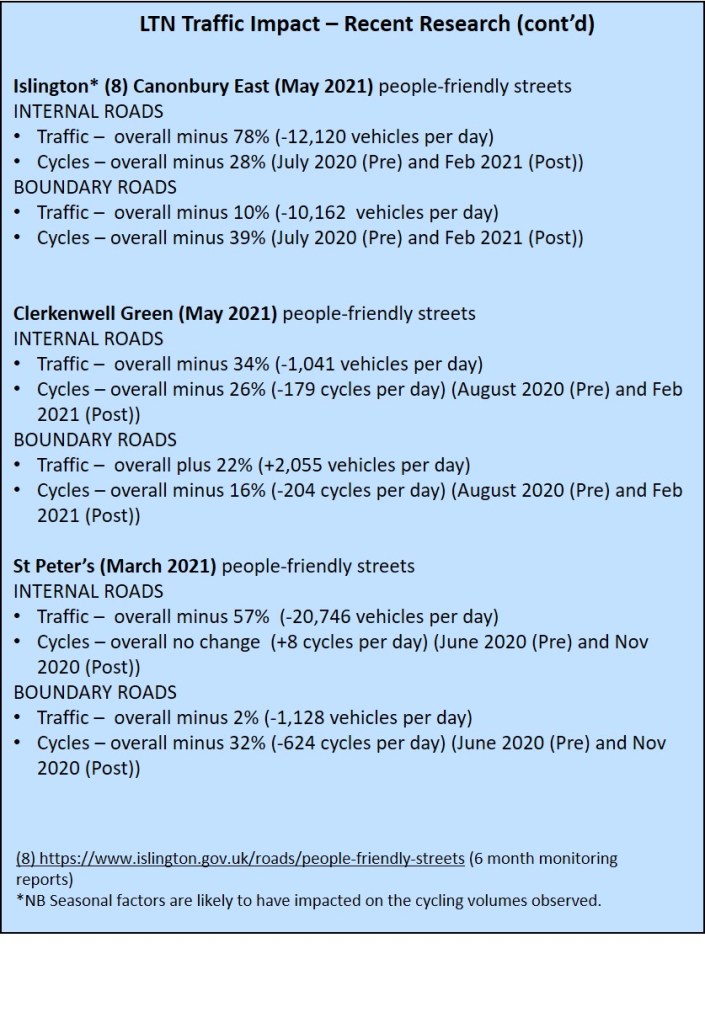
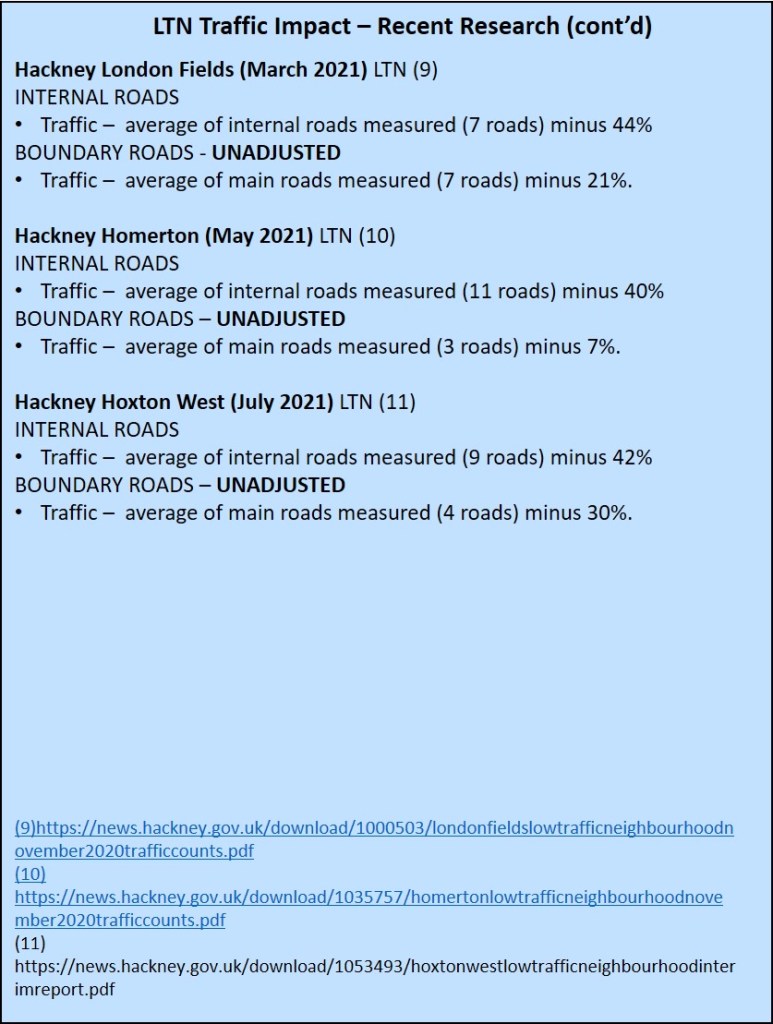
Detailed Results. The detailed results are shown in the jpegs below and are brought together here.
[1] Making use of the data from Hackney as shown in the spreadsheet.
[1] https://www.walthamforest.gov.uk/content/increased-levels-walking-and-cycling-extend-life-expectancy-waltham-forest-residents-least
[2] https://www.sciencedirect.com/science/article/pii/S0965856417314866

2 Replies to “Impact of 2020 Low Traffic Neighbourhoods in London – initial traffic counts now in from 4 London boroughs.”